POI Design
POI Design Tool is a flexible tool, which supports the network planning engineer in selecting the Point Of Interconnections (POIs) with consideration of economy. The tool makes the following functionalities available:
- Optimal determination of the POIs
- Performing POI roll-out
- Calculation of the interconnection charges (IC-Charges), ICAs- and TN-costs
- Calculation of the IC-, ICAs-traffic
- Dimension of the ICAs
- Determination of the regional traffic distribution
- Determination of the POI catchment areas
The objective of the POI optimization is the total
costs,
whereby the basic conditions must be kept like overlap-free catchment areas, link blocking
for the dimension of the ICAs. The POI optimization supplies the number and
the position of the POIs, the number of ICAs of each POI, incoming/outgoing traffic,
the catchment areas, the regional traffic distribution and the costs.
By specification of the position of the POIs it is otherwise possible, to
calculate the costs, the number of ICAs of each POI, incoming/outgoing traffic,
the catchment areas and the regional traffic distribution. Operating with the
tool is facilitated by the program MapInfo for the visualization of the
POIs locations and the catchment areas.
The main component of the tool is the program poides.exe, which performs
the optimization of POIs and the calculation of other variables.
Since the POI optimization is a computer-bound process, the program
poides.exe was implemented in C++ to produce efficient machine codes.
Additionally C++ program codes can be easily ported to other machines
e.g. SUN Sparc or SUN Ultra with the operating system SunOS or Solaris,
which offers a further advantage.
Microsoft Excel is used for user-front-end. Excel provides functionalities of spreadsheet calculation, data analysis as well as calculations of all kinds. Data can be represented with Excel in the form of different diagrams both on the display and on the printer. Additionally Excel offers Visual Basic for Application (VBA) as tool for many arithmetic computations, automation of the routine jobs etc. By the combination of Visual Basic and C++ the request at suitable user interface and short computing time are fulfilled.
Catchment Areas
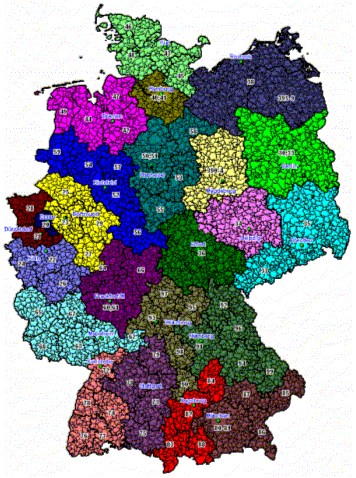
o.tel.o Voice network is planned based on defined traffic sources and destinations. Thus, catchment areas corresponding to the expected traffic sources and destinations were defined. The assumption is that the catchment areas are geographically the same for both sources and destinations of traffic.
It is intended that o.tel.o will primarily serve the mass-market as a Long-Distance carrier to indirect customers. Additionally, large customers with direct network access will be targeted. When defining the catchment areas it is necessary to distinguish whether they handle indirect or direct traffic or a combination thereof.
The following picture shows the graphical view of POI catchment areas (created with MapInfo Professional):

Cost Model
The cost model comprises of interconnection charges (VE), the costs of the IC links (ICAs) and the costs of the transmission network (TN) e.g. POP, leased lines.

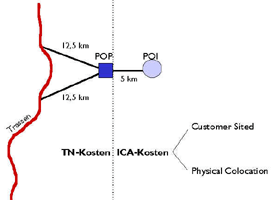
The costs VE depend on the traffic volume, traffic distribution, types of traffic and the distance between traffic source (indirect) to the POI. The ICAs costs consist of provisioning costs and annual operating costs, which depend on the number of IC links and the distance of the POI to the transmission network point (POP or Container). Depending upon POI type (Customer Sited or Physical Collocation) lines of DTAG can be rented, so that other cost factors for the transmission network (TN) can result. The optimization problem is to determine the POIs in such a way that the total costs are minimal. The optimization model can summarized be formulated as follows:

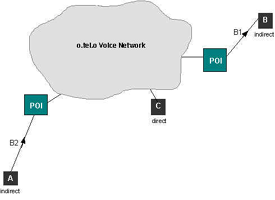
Illustration of the interconnection charges (VE)
- Service B1: Connection into DTAG network (national call termination)
- Service B2: Connection from DTAG network (national call origination)

Illustration of the ICAs- and TN-costs

